Melkveehouderij – Velos 2016.2
Software versie melkveehouderij - Velos 2016.2
Software versie melkveehouderij - Velos 2016.2
The 2016.2 release contais several features that make you work with Velos easier and faster. This second software release of 2016 includes – amongst others – the following topics:

The Velos interface (website) is now fully responsive. Velos adjusts all screens to the used device (PC, tablet, smartphone) automatically. This means all functionality is available on all devices. The mobile interface of Velos is no longer used. Since the software is responsive, this is no longer necessary.
Vanaf de 2016.2-update zijn de tabellen sorteerbaar. Wanneer u op het pictogram klikt, kunt u de gegevens in de tabel sorteren van hoog naar laag of van laag naar hoog. Bovendien kunt u de diergegevens bij het controleren van tabellen direct openen. Klik op een pictogram met een blauwe pijl om de individuele diergegevens te bekijken die rechtstreeks naar hetzelfde scherm schuiven.
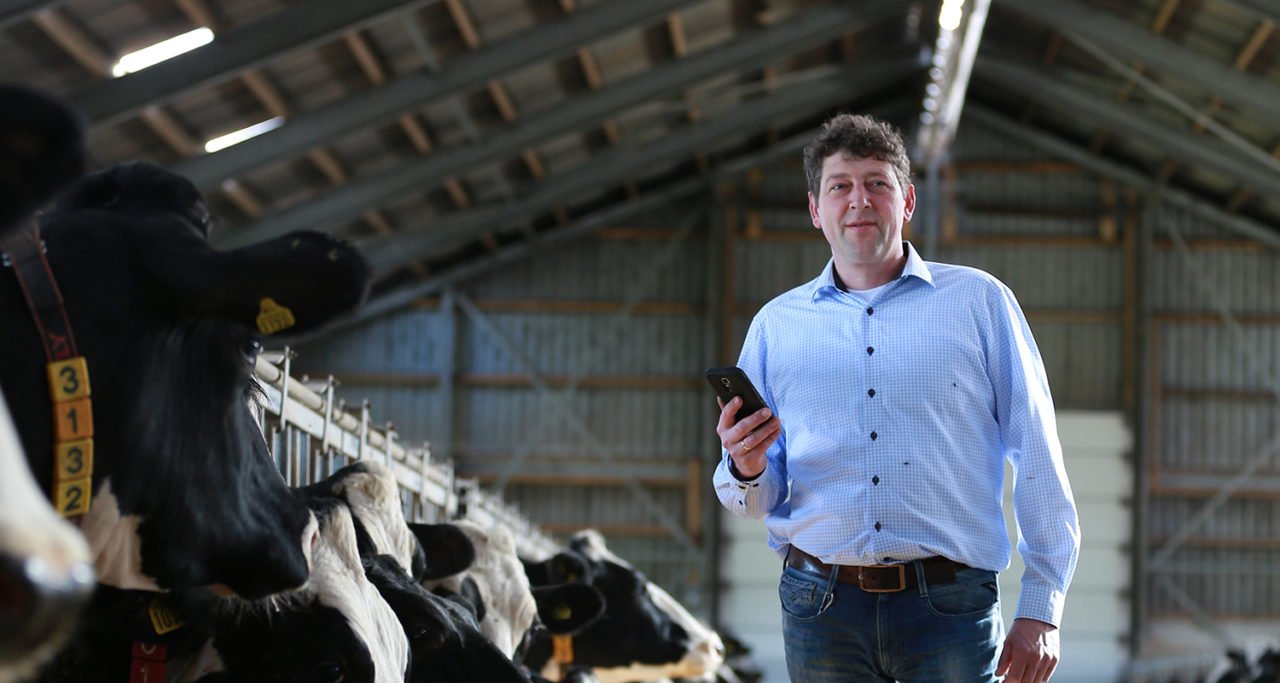
The Smarttag Neck has been expanded with a number of unique and valuable features. Within Health Management, unique parameters have been added. Group Monitoring has been expanded with various insights.
The new measurements rumination, time inactive and time being active provide additional data for the health and management module of Velos. The whole 24 hour time budget of the dairy cow is measured, leading to more insight and large improvements in the health attention algorithms.
On group level these measurements give the farmer more insight in the feed/feeding management on the farm. The herdresponse on ration changes can be seen when checking the eating and rumination times. This gives the farmer a real hands on tool to work with and steer towards an optimal ration.
The new 48 hour graph shows the farmer how many cows ate at which particular time of the day. Farmer/personnel actions and their effect on the entire herd are visible, giving the farmer the opportunity to optimize his feed management.
Download an overview of the latest issues released in the 2016.2 version
Download overviewZoekresultaten voor: ''
Er zijn geen resultaten met uw zoekcriteria. Probeer a.u.b. opnieuw met andere criteria.
